Blood Test Visualizer
A patient-focused PWA that transforms raw blood test data into clinically-contextualized, interactive visualizations for tracking chronic lymphocytic leukemia (CLL) treatment response.
App in Action
Project Details
Problem / Approach / Result
Raw lab reports lack clinical context for patients
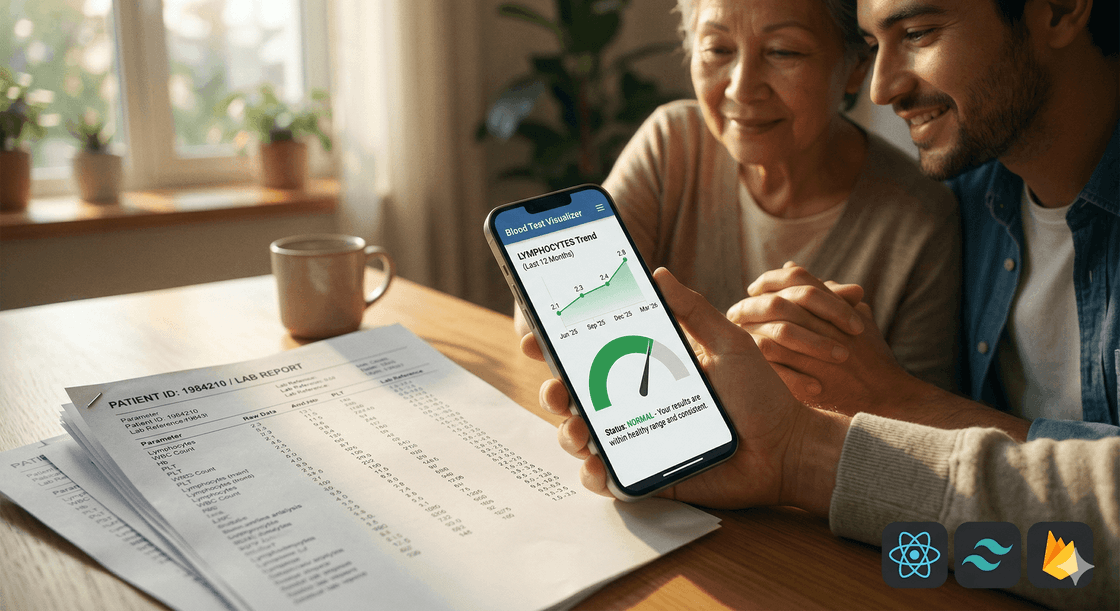
A family member undergoing treatment for Chronic Lymphocytic Leukemia (CLL) was receiving regular blood test reports -- dense PDF tables with dozens of values but no narrative. Understanding which numbers were improving, which were concerning, and how they trended over years of treatment required a physician to interpret. Between appointments, the patient and family had no way to quickly assess the trajectory of their fight.
- Lab PDFs are not designed for patient comprehension
- No historical trend visibility across months or years of treatment
- Clinical thresholds differ for CLL patients vs. general population
- Family members needed reassurance between physician visits
Build a CLL-specific, clinician-informed visualization layer
Rather than building a generic health dashboard, the app was designed around one patient's specific treatment journey. A clinical metadata engine maps each test result against CLL-specific thresholds with physician-reviewed zone definitions. Interactive gauges and historical trend charts let the family see at a glance whether values are improving, stable, or concerning.
- Defined clinical zones per test with CLL-specific thresholds
- Color-coded gauge and trend visualizations (green/yellow/red)
- Embedded physician-written analysis for each biomarker
- Progressive Web App for offline, bedside access on any device
- Accessibility-first with ARIA labels, keyboard navigation, color-blind safe patterns
Immediate clarity and peace of mind
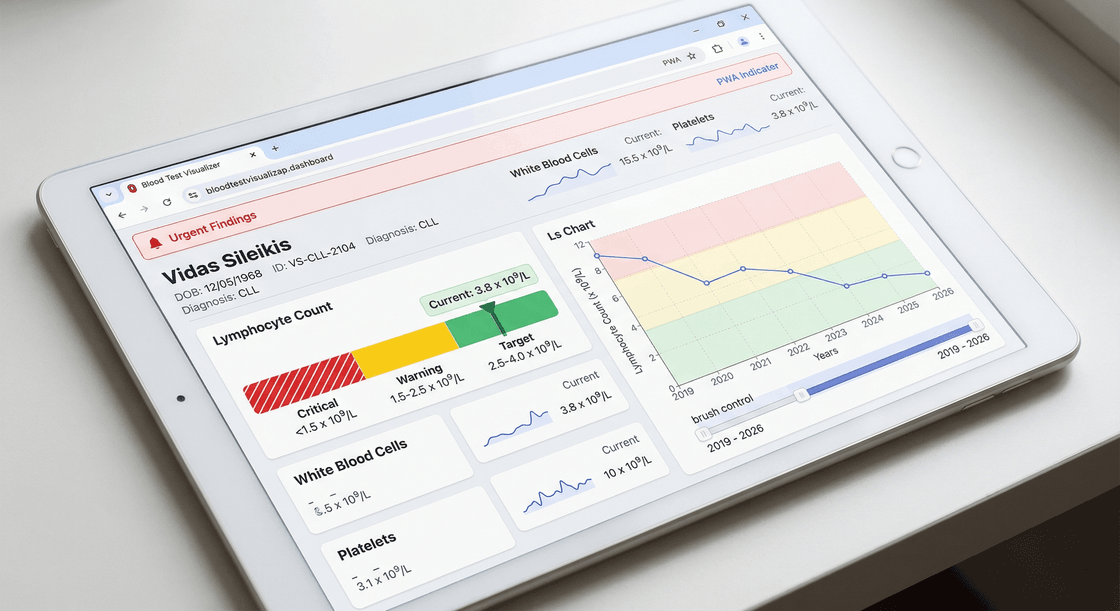
The family can now open the app on any device and within seconds understand the status of all 12 tracked biomarkers. Historical trend charts spanning 5+ years of treatment data tell the story of recovery at a glance. Urgent findings are surfaced prominently so nothing is missed. The app serves as a bridge between appointments -- translating clinical data into a language the whole family can read.
- 12 biomarkers tracked with 26+ data points each across 5 years
- Sub-second load time with static data and Vite optimization
- Works offline via PWA -- critical for hospital environments with poor WiFi
- Responsive across phone, tablet, and desktop
- Lithuanian-language header honoring the patient's heritage
Key Features
Clinical Zone Engine
Each test is evaluated against CLL-specific thresholds -- not generic lab ranges. Zones map to Critical, Borderline, and Normal with physician-reviewed messages.
Interactive Trend Charts
Recharts-powered line charts with color-coded background zones, reference lines, and a brush control for zooming into any time period across 5+ years of data.
Visual Gauge
Horizontal gauge bar with dynamic scaling, threshold markers, and diagonal stripe patterns in critical zones for color-blind accessibility.
Urgent Findings
Critical conditions like severe pancytopenia, acute kidney injury, and hepatitis are surfaced in a prominent alert banner at the top of the dashboard.
PWA / Offline Access
Installable as a Progressive Web App with offline capability -- essential for hospital and clinic environments where WiFi is unreliable.
Accessibility-First
WCAG-compliant with ARIA labels, semantic HTML, keyboard navigation, focus-visible rings, and color-blind safe patterns throughout.
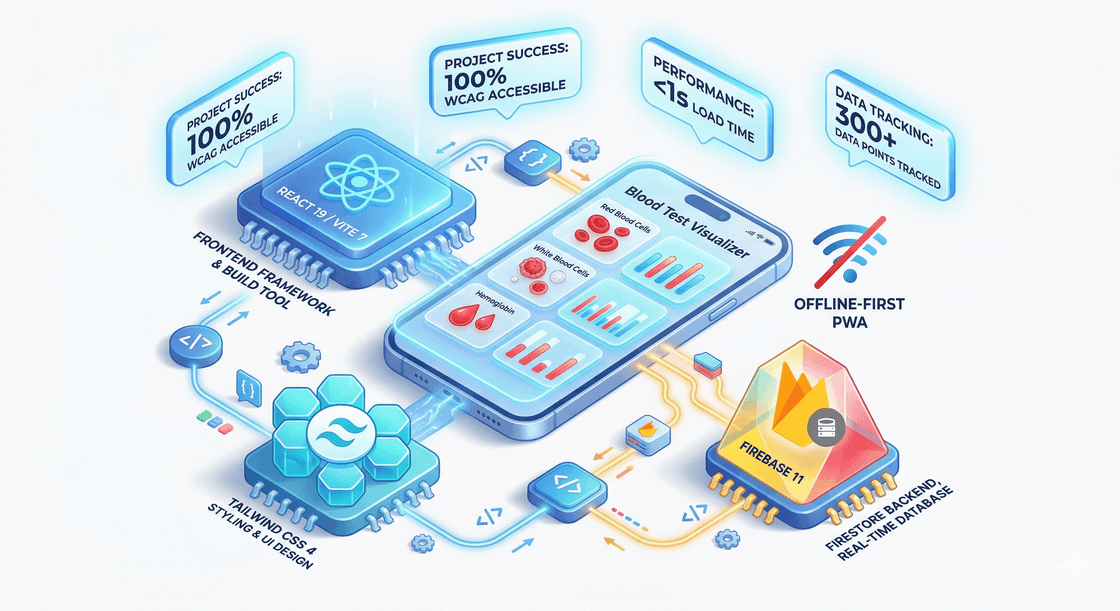
Architecture
Firebase Firestore for persistence, with a static data module as the current source of truth for 300+ test records.
Clinical metadata engine classifies each result into zones using CLL-specific thresholds and generates physician-level context.
React 19 components for blood test cards, visual gauges, trend charts, and urgent findings -- all built with Tailwind CSS.
Recharts powers interactive line charts with reference zones, brush zoom, and animated tooltips for temporal analysis.
Key Metrics
Tech Stack
Component-based UI with hooks for state management
Lightning-fast HMR and optimized production builds
Utility-first responsive design system
Composable, interactive data visualization
Firestore database and authentication
Consistent, accessible icon library
Service worker, manifest, offline support
Client-side page navigation
| Category | Technology | Purpose |
|---|---|---|
| Frontend | React 19 | Component-based UI with hooks for state management |
| Build | Vite 7 | Lightning-fast HMR and optimized production builds |
| Styling | Tailwind CSS 4 | Utility-first responsive design system |
| Charts | Recharts 3 | Composable, interactive data visualization |
| Backend | Firebase 11 | Firestore database and authentication |
| Icons | Lucide React | Consistent, accessible icon library |
| PWA | Vite PWA Plugin | Service worker, manifest, offline support |
| Routing | React Router 7 | Client-side page navigation |